Usage
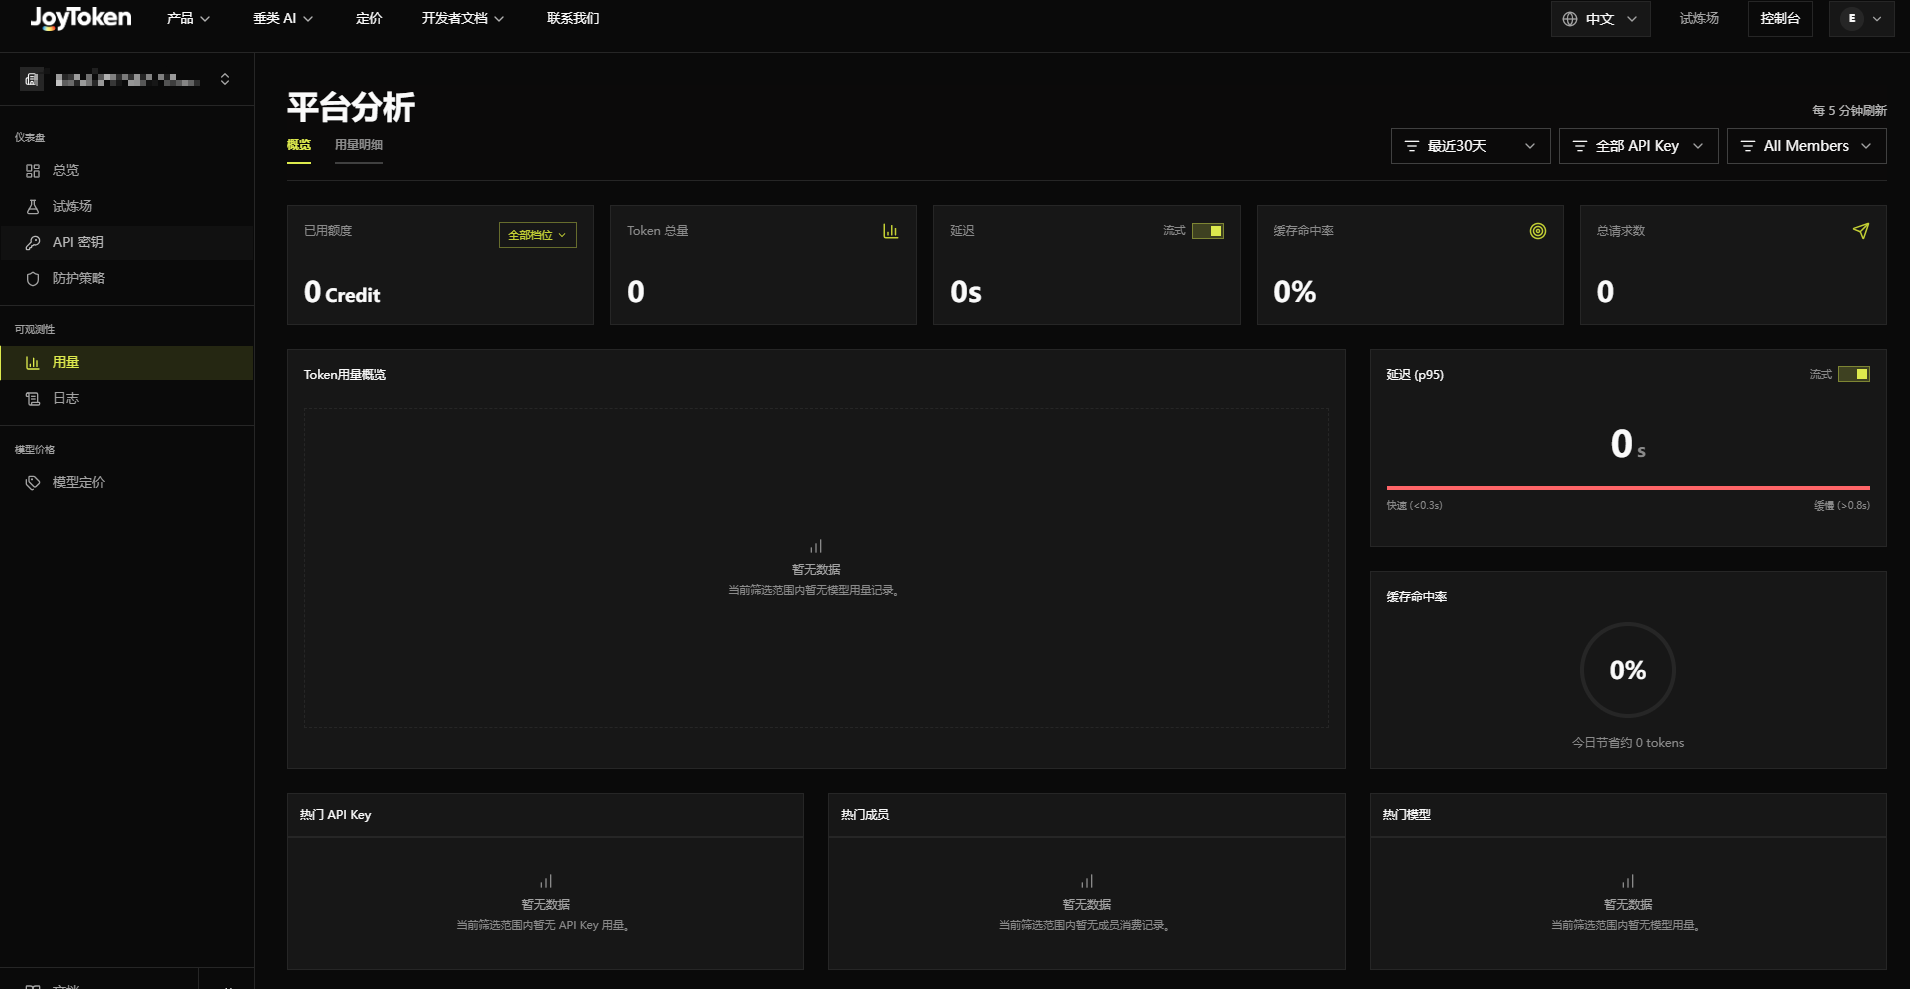
Workspace usage and performance analytics refresh every 5 minutes. Filter the Overview and Usage Details tabs by Time Range and API Key.
Overview
Metrics include Credits Used, Total Tokens, Latency, Cache Hit Rate, and Total Requests. Charts cover token usage, p95 latency, cache savings, Top API Keys, Top Members, and Top Models.

Usage Details
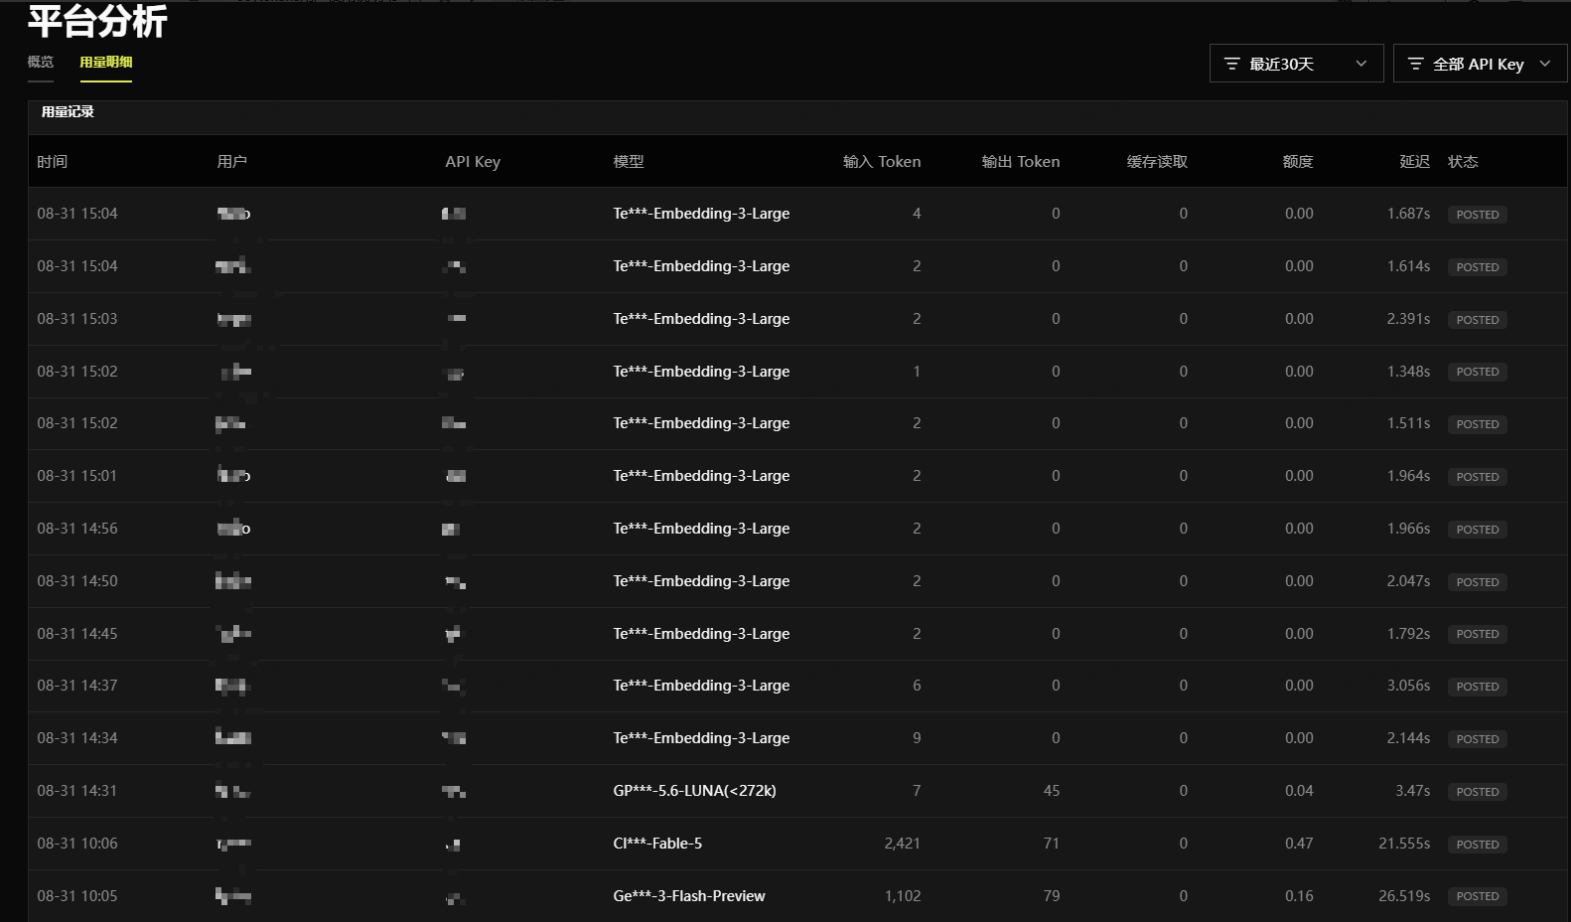
Switch to the Usage Details tab to inspect each individual API call.
Top filters
- Time Range: defaults to Last 30 days; switchable to Last 7 days or Last 24 hours.
- API Key: defaults to All API Keys; filter by a specific key.
Usage record table columns
- Time: when the call was made (MM-DD HH:mm).
- User: the caller’s username.
- API Key: the key name/alias used.
- Model: the model called (partially masked, e.g.
Te***-Embedding-3-Large). - Input Tokens: input tokens consumed by the request.
- Output Tokens: output tokens returned by the model.
- Cache Read: tokens read from cache hits.
- Credits: the cost/credits deducted for this call.
- Latency: request duration in seconds.
- Status: call result status (e.g.
POSTEDfor recorded).